
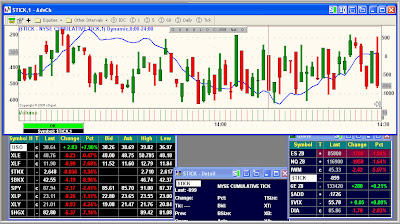
1.Dr. Steenbarger's Chart Setup for Trading- "Most of my research (identifying market themes, relevant trading ranges, daily pivot points) has been done prior to the market open. During market hours I'm simply following ES futures and NYSE TICK on a one-minute basis, toggling occasionally to 5- and 60-minute charts, and keeping my eye on sectors, Treasury rates, and commodities. My short-term trade ideas involve updating odds of hitting particular near-term price levels (trading range extremes, R1 or S1 pivot points, prior day's high or low price). My longer-term ideas involve updating odds of hitting similar price levels from daily/weekly periods. Almost all my trades attempt to follow trends in NYSE TICK and Market Delta that are not fully evident in price movement."
Platforms used- NeoTicker for contrustuction of modified TICK chart, and MarketDelta for reference (volume traded at bid/offer for stock index futures), and eSignal for real time quotes.
Neoticker
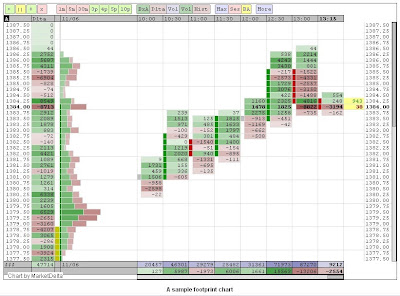
Markete Delta
 2.Trader BZB Chart Setup for Trading- "The TICK, shown here on 2 minute bars, although I toggle to 1 minute bars for the open.I overlay the pivots on the TICK and also use an 8 & 16 MA to gauge sentiment changes.The three vertical columns under the TICK are a nice little feature of the platform that provide a tick by tick rolling scroll of new intraday high and low counts. I use this feature 3 times . . one each for the NAZ, NYSE and the indices. so I catch the full flavor of the market trend in real time. When the market's weak, all the scrollers will be running all red and rolling fast. When the markets are about to reverse up, the scrollers will roll very slowly and will be punctuated with periodic green tells of buying. In flat markets the scrollers will be a hodgepodge of red and green and typically scroll by slowly. Coupled with the NYAD chart, these 3 scrollers are invaluable in keeping me on the right side of momentum, even as the market makers are trying to head fake me in another direction.
Below the 3 scrollers, I watch charts of the NYAD and the IWM in 2 minute bars.
Both charts are overlaid with the pivots, 8/16 MAs and the 3/14/3 signal line, which is the moving average component of the MACD.
To the sides, I have 2 charts of the day, typically the Qs and XLF or XLE or IWM if I'm looking for a closer look at the technicals and fibs than the lower middle chart provides. Each chart displays the fibs, parabolics, pivots and 8/16 MAs as well as my technical suite of RSI, %D and StochRSI. Each chart has its own trading window to help old guys like me from getting confused when placing orders and I can instantly toggle from stocks to option string to level 2 options.
I have another SSPro screen that I watch with similar features, but that screen also includes, news, messages, account details, multiple watch lists and a programmable stock scanner, but the trading screen shown is really the core workhorse of the program for me."
Platforms used- Schwab StreetSmart Pro.
Schwab StreetSmart Pro

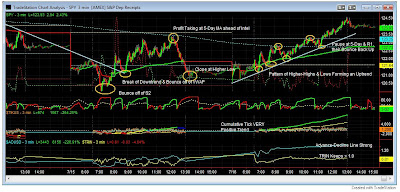
3.Market Rewind Chart setup for Trading-
- Light Horizontal Lines/ Day Trader Pivots - Pivots take the prior day's absolute range and divide it into sections. The gold line is the Pivot, lines below it are 'Support', lines above are 'Resistance'.
- Solid Bold Green & Red Line/ Volume Weighted Average - The daily average price weighted by the volume of shares transacted at each price bar.
- Dashed Light Blue Line/ Five-Day Moving Average - Speaks for itself. Lots of computer program trades track this line. In general, the expectation is that the market will behave relatively bullishly above the line, bearishly below. Where price lies relative to longer-term moving averages, such as the 20, 50 and 200-day, also tells alot about the current environment. In addition, they often represent key-levels in their own right.
- General Behavior/ Higher-Highs & Higher-Lows -or- Lower-Lows & Lower-Highs - The behavior of price action tells you if accumulation or distribution is occurring within a trend.
Platforms used- Tradestation
TradeStation
 4.Valuemanagementpartner Chart Trade Setup-
Platforms used- Tradestation
I use three screens in Tradestation for my trading. I trade stocks, options and index futures, mainly ES, the S&P 500 e-mini contract. Screen #1 is my main screen for no matter what I’m trading. It has 4 charts: 5min, 15min, 60min and daily. It also holds my Matrix window which provides bid and ask prices and market depth. I can also place my orders from the Matrix window.
Desktop #1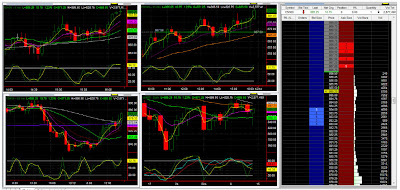
On Screen #2 I have a 2min, 5min, and 15min charts with RSI, Stochastics and MACD indicators. I also use Bollinger bands and Pivot Points.
Desktop#2
Screen #3 has a view of the overall market using an Advancing/Declining Issues histogram, and A/D Volume histogram, TRIN and TICK values. There are also 2 charts that I use strictly for Index Futures, 512 Tick and 1 minute charts. In Tradestation it is very easy to change the time value for the charts, so I can quickly change the time scale to 1024 ticks and 3 minute charts.
Desktop#3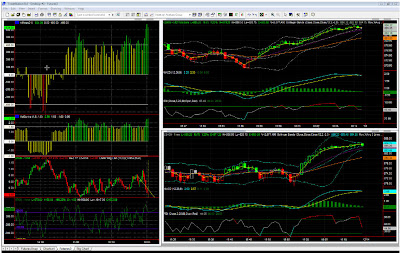 How do I use them? Well, since I’ve been trading a lot of ES futures contracts, here’s what I’m looking for in an entry: I want RSI3 rising from an oversold condition on the 5min. In the MACD (12,26,9), the fast ma must be above the slow ma, and, the fast ma should be above the zero line. Stochastic should be rising and I like to see the 3ema crossing up through the 13ema. I place the order with a stop loss 4 points below my entry. When price gets 3 points above my entry, my stop loss comes up to breakeven and I trail the price 3 points behind from there on.


