26.9.09

Trading Blogs- How to trade using Stock Chart Setups

I've Compiled a list of Trader Blogs that share there chart setups and include how they trade. If you would like to be included in the list leave me a comment and I'll checkout your website.

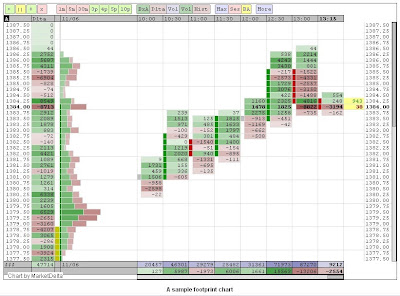
1.Dr. Steenbarger's Chart Setup for Trading- "Most of my research (identifying market themes, relevant trading ranges, daily pivot points) has been done prior to the market open. During market hours I'm simply following ES futures and NYSE TICK on a one-minute basis, toggling occasionally to 5- and 60-minute charts, and keeping my eye on sectors, Treasury rates, and commodities. My short-term trade ideas involve updating odds of hitting particular near-term price levels (trading range extremes, R1 or S1 pivot points, prior day's high or low price). My longer-term ideas involve updating odds of hitting similar price levels from daily/weekly periods. Almost all my trades attempt to follow trends in NYSE TICK and Market Delta that are not fully evident in price movement."

Platforms used- NeoTicker for contrustuction of modified TICK chart, and MarketDelta for reference (volume traded at bid/offer for stock index futures), and eSignal for real time quotes.
Neoticker
Markete Delta


2.Trader BZB Chart Setup for Trading- "The TICK, shown here on 2 minute bars, although I toggle to 1 minute bars for the open.I overlay the pivots on the TICK and also use an 8 & 16 MA to gauge sentiment changes.The three vertical columns under the TICK are a nice little feature of the platform that provide a tick by tick rolling scroll of new intraday high and low counts. I use this feature 3 times . . one each for the NAZ, NYSE and the indices. so I catch the full flavor of the market trend in real time. When the market's weak, all the scrollers will be running all red and rolling fast. When the markets are about to reverse up, the scrollers will roll very slowly and will be punctuated with periodic green tells of buying. In flat markets the scrollers will be a hodgepodge of red and green and typically scroll by slowly. Coupled with the NYAD chart, these 3 scrollers are invaluable in keeping me on the right side of momentum, even as the market makers are trying to head fake me in another direction.
Below the 3 scrollers, I watch charts of the NYAD and the IWM in 2 minute bars.
Both charts are overlaid with the pivots, 8/16 MAs and the 3/14/3 signal line, which is the moving average component of the MACD.
To the sides, I have 2 charts of the day, typically the Qs and XLF or XLE or IWM if I'm looking for a closer look at the technicals and fibs than the lower middle chart provides. Each chart displays the fibs, parabolics, pivots and 8/16 MAs as well as my technical suite of RSI, %D and StochRSI. Each chart has its own trading window to help old guys like me from getting confused when placing orders and I can instantly toggle from stocks to option string to level 2 options.
I have another SSPro screen that I watch with similar features, but that screen also includes, news, messages, account details, multiple watch lists and a programmable stock scanner, but the trading screen shown is really the core workhorse of the program for me."

Platforms used- Schwab StreetSmart Pro.

Schwab StreetSmart Pro


3.Market Rewind Chart setup for Trading-
  1. Light Horizontal Lines/ Day Trader Pivots - Pivots take the prior day's absolute range and divide it into sections. The gold line is the Pivot, lines below it are 'Support', lines above are 'Resistance'.

  2. Solid Bold Green & Red Line/ Volume Weighted Average - The daily average price weighted by the volume of shares transacted at each price bar.

  3. Dashed Light Blue Line/ Five-Day Moving Average - Speaks for itself. Lots of computer program trades track this line. In general, the expectation is that the market will behave relatively bullishly above the line, bearishly below. Where price lies relative to longer-term moving averages, such as the 20, 50 and 200-day, also tells alot about the current environment. In addition, they often represent key-levels in their own right.

  4. General Behavior/ Higher-Highs & Higher-Lows -or- Lower-Lows & Lower-Highs - The behavior of price action tells you if accumulation or distribution is occurring within a trend.
There is no magic to these levels, but many traders have these same indicators up on their screens and they often act like magnets for day traders and buy/sell programs alike. Cumulative Tick, the Advance-Decline Line and Arms Index/TRIN also provide important clues as to what's happening "under the hood."

Platforms used- Tradestation

TradeStation

4.Valuemanagementpartner Chart Trade Setup-

Platforms used- Tradestation

I use three screens in Tradestation for my trading. I trade stocks, options and index futures, mainly ES, the S&P 500 e-mini contract. Screen #1 is my main screen for no matter what I’m trading. It has 4 charts: 5min, 15min, 60min and daily. It also holds my Matrix window which provides bid and ask prices and market depth. I can also place my orders from the Matrix window.

Desktop #1
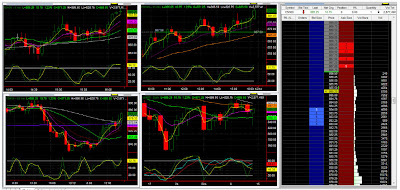

On Screen #2 I have a 2min, 5min, and 15min charts with RSI, Stochastics and MACD indicators. I also use Bollinger bands and Pivot Points.

Desktop#2

Screen #3 has a view of the overall market using an Advancing/Declining Issues histogram, and A/D Volume histogram, TRIN and TICK values. There are also 2 charts that I use strictly for Index Futures, 512 Tick and 1 minute charts. In Tradestation it is very easy to change the time value for the charts, so I can quickly change the time scale to 1024 ticks and 3 minute charts.

Desktop#3

How do I use them? Well, since I’ve been trading a lot of ES futures contracts, here’s what I’m looking for in an entry: I want RSI3 rising from an oversold condition on the 5min. In the MACD (12,26,9), the fast ma must be above the slow ma, and, the fast ma should be above the zero line. Stochastic should be rising and I like to see the 3ema crossing up through the 13ema. I place the order with a stop loss 4 points below my entry. When price gets 3 points above my entry, my stop loss comes up to breakeven and I trail the price 3 points behind from there on.

QuoteTracker currency commodity bond stock futures chart layout


Gold is nearing 1000, JPY is the most bullish currency, the Canadian dollar and Peso are weakest currencies. Bond futures (ZN -10 yr bond future) has good correlation with JPY lately. ES and Crude correlation has also been good lately.

A Sample Trading Plan

Jeff Quinto has a video on the CME website on how to setup a trading plan.
Here are the key topics Jeff suggests and my answers:

Which contract or stock will I trade?

I'm trading stocks and futures.

What time period will I trade?

I trade the first 3 hours of market open primarily, while liquidity is best.

What setups will I take?

I discretionary trade the automated signals I have created. I determine if the current market condition suites any trade signals my system generates and then I choose whether or not to take the trade.

What Risk parameters do I use?

I have a max daily stop loss in place in case I make too many bad trades.

What do I do after 3 losing trades?

I determine if I should stop trading based on if I'm feeling frustrated or if I should keep trading my signals until my daily max loss is reached.

What is my strategy for increasing or decreasing my trading size?

I trade 1-2 contracts for the initial position and only add to winners on clear trending trades (market internals heavily favor bulls/bears -ie TICK and NYSE A/D favor bulls/bears).

How many ticks or points am I trying to make per day?

I don't have a set target, I only take what I can get.

How many trades do I make per day?

I only make 3 to 5 trades per day on average. Most trading days only make 3 significant swings, so my primary goal is to be apart of the primary move or catch a reversal swing or continuation trade.

How long do I plan to hold winners or losers?

I hold winners as long as possible, scaling out as I see fit. I hold losers for as long as I need to as long as my stop is not hit.

How do I record my progress?

I keep a journal of my trades with trade statistics and a chart showing where I placed my trades.

Who do I call if my computer or internet has a problem?

I have stops in place for all my trades so I'm covered, however I can also access my account from my phone or call my broker.

How to Run Multiple Instances of QuoteTracker Trading Software

Make a copy of the entire QuoteTracker folder, not just the stocks.exe file. (Ex. If your current folder for QT is "c:\program files\quotetracker" make a folder "c:\program files\quotetracker2" (or whatever)). Then copy the entire contents of the "c:\program files\quotetracker" folder (including sub-folders) into the "c:\program files\quotetracker2" folder.

After that, make a shortcut to the stocks.exe file in the new c:\program files\quotetracker2 folder. Your original shortcut should point to "c:\program files\quotetracker\stocks.exe" and the new shortcut should point to "c:\program files\quotetracker2\stocks.exe"

Both of these shortcuts now need the "allowdup" command line argument added to them in the Target box, so that they will look like this:
"c:\program files\quotetracker\stocks.exe" allowdup
"c:\program files\quotetracker2\stocks.exe" allowdup
(Note: allowdup is outside of the quotes and there is a space before it.)

After that final step, you can double click the 2 shortcuts and each will start a separate instance of QT.

For more answers to FAQ go to the QT forum.

HPT ATS Trade Statistics


I'm still working on my ATS. I plan on posting its results on my blog on a regular basis to give this blog more content and help me track its progress.
I have the ATS sending orders to an Interactive Brokers Simulated Account.
Today I took the same trade that the ATS fired and it worked.
I am still working on this ATS for trading NQ.

The ATS only signaled 1 trade today. A 2pt set stop and 3 pt target we're fixed in place. I manually adjusted the stop down and the stop was hit for 1.5pt profit. The trade statistics can be seen in the picture.

I think I will provide a full view of the ATS trade statistics for all the trades taken at the end of the trading week/month and put these results in an EXCEL/ GOOGLE Pivot table as shown below. Perhaps when I accumulate more statistics on the trading I will provide a chart of the P/L performance along with the corresponding trade statistics. I love Pivot tables.

HPT ATS TRADE STATISTICS

Futures trading

Introduction aux options

Définition – qu’est-ce qu’une option ?
Une option est un contrat conclu entre deux parties qui confère à l’acheteur le droit, contre paiement de la prime,

Exemple
…………………………………………………………………………………………………..
…d’acheter → option d’achat = call
…………………………………………………………………………………………………...
…ou de vendre → option de vente = put
…………………………………………………………………………………………………...
…une certaine quantité → taille du contrat 100 actions …………………………………………………………………………………………………...
…un bien déterminé → sous-jacent actions Intel
…………………………………………………………………………………………………...
…à ou jusqu’à une date spécifiée → date d’expiration 18.04.2004
…………………………………………………………………………………………………...
…et à un prix fixé d’avance → prix d’exercice 55
…………………………………………………………………………………………………...

Le vendeur (l’émetteur) d’une option prend l’engagement de vendre (call) ou d’acheter (put) le sous-jacent si l’acheteur fait valoir son droit (c’est-à-dire exerce son option). En contrepartie, il encaisse la prime versée par l’acheteur.S’il s’agit d’options américaines, l’acheteur peut exercer son droit à tout moment avant la date d’expiration ; s’il s’agit d’options européennes, il ne peut le faire que le dernier jour de cotation.

Forex trading avec Saxotrader et Interforex

Opérations Forex
-
Opérations sur marges à des taux de marges requises très bas. Avec les premiers $10,000 de votre investissement, obtenez un effet de levier qui peut atteindre 100, et un effet de levier sur vos couvertures additionnelles qui peut atteindre 50
-
Devises: opérations sur devises au comptant, ordres d'opérations souples, options sur devises de gré à gré et opérations sur devises à terme.
-
Transactions en temps réel directement depuis votre ordinateur sur des cours en temps réel
-
Transactions sur plus de 100 cours croisés de devises http://www.interforex.ch/fr/conditions_utilisation.php. Plus que tout autre fournisseur en ligne
-
Faibles écarts acheteur/vendeur, et pas de commissions
Grâce à nos faibles taux de marges requises, bénéficiez d' un effet de levier important sur vos investissements Forex
Spéculez sur les écarts et profitez de l'effet de levier sur investissements pour un impact plus fort sur le marché. Nos taux de marges requises sont parmi les plus bas du marché. Pour les premiers $10,000 de votre couverture d'investissement, un investissement de $10,000 seulement peut être utilisé pour ouvrir des positions allant jusqu'à 1 Million $, multipliant ainsi votre investissement jusqu'à 100 fois. Les couvertures supplémentaires peuvent être multipliées jusqu'à 50 fois. Vous devez toujours conserver une marge de 2% sur votre compte et une marge de 4% pendant les week-ends.
Ecarts acheteur/vendeur Forex
Les transactions sur devises à la Saxo Bank sont exonérées de commission, et l'écart acheteur/vendeur est maintenu à un niveau très bas sauf en cas de conditions de marché extrêmement volatiles. Plus d'informations

Opérations directement en ligne http://www.interforex.ch/fr/operation_comptant.php
La plate-forme de transactions SaxoTrader vous permet d'effectuer des transactions sur devises en même temps que des transactions sur tous nos autres produits depuis une seule et unique plate-forme intégrée. SaxoTrader offre également une quantité importante d'informations concernant le marché ainsi que tous les outils dont vous avez besoin pour investir avec succès. Plus d'informations http://www.interforex.ch/fr/operation_comptant.php
Opérations Forex au comptant fondées sur des cours en temps réel
Effectuez des opérations sur devises au comptant avec des cours en temps réel reçus en continu sur votre plate-forme de transactions. Plus d'informations http://www.interforex.ch/fr/operation_comptant.php
Ordres d'opérations souples
Ouvrez et liquidez automatiquement des positions Forex lorsqu'un cours croisé atteint un cours spécifique grâce à nos ordres d'opérations souples. Plus d'informations

Options de gré à gré
http://www.interforex.ch/fr/options_forward_outrights.php
Effectuez des opérations sur options sur devises de gré à gré via notre plate-forme SaxoTrader de transactions.Plus d'informations

Opérations Forex à terme
Achetez et vendez des devises à termes en ligne pour vos futures transactions de marchandises en devises ou pour spéculer sur les différentiels de taux d'intérêt.Plus d'informations http://www.interforex.ch/fr/spreads3.php

Bourse en ligne & futures trading

Intervenants sur les marchés dérivés
Il existe 3 types d’intervenants sur les marchés dérivés.
Les hedgersIls utilisent les produits dérivés pour couvrir leur portefeuille contre le risque de baisse du marché.
Les spéculateursIls représentent la contrepartie naturelle aux hedgers.Leur attitude est celle de parieurs : en fonction de leurs anticipations, ils prennent des positions à l’achat ou à la vente sur les produits dérivés concernés. La différence essentielle entre le marché des dérivés et celui des actifs sous-jacents réside dans les montants à investir, il s sont beaucoup moins élevés pour les produits dérivés. Les spéculateurs sont intéressés à l’effet de levier que permet les produits dérivés par rapport aux actifs sous-jacent dû aux faibles mises à mettre en jeu.
Les arbitrageursTrès actifs sur les marchés, leur but est de réaliser des profits sans risques, en profitant des différences de prix entre deux marchés ou deux produits, et des conditions favorables dont ils bénéficient. Exemple : si le $ à un cours supérieur en europe par rapport aux usa, alors un arbitragiste achètera du $ aux usa et en vendra en europe.
Vente à découvert( position short , l’acheteur est long)La vente à découvert consiste à vendre un bien sans le détenir. Ceci n’est possible que sur les marchés à terme ( et le RM ), lorsque l’échange ne se fait pas au même moment que la conclusion (ou dénouement) de la transaction. Pour le vendeur à découvert, le but est de se racheter à un prix inférieur auquel il a vendu, et avant l’échéance prévue sinon l’échange n’aura pas lieu. Un vendeur à découvert spécule à la baisse. http://www.interforex.ch/fr/index.php http://www.interforex.ch/fr/forex.php